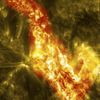
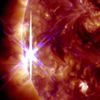
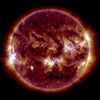
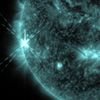
Unikátní snímky NASA: Sluneční erupce v detailu

Přehled fotografií
  • SDO, solární observatoř NASA, sleduje Slunce nepřetržitě na různých vlnových délkách. Tento snímek znázorňuje magnetické vlákno solární erupce, které projelo sluneční atmosférou, zanechávajíc za sebou cosi, co vypadá jako plamenný kaňon. Ve skutečnosti samozřejmě nejde o oheň, ale o plazmu - částice tak horké, že se jejich elektrony vypaří, čímž vzniká nabitý plyn protkaný magnetickými poli. Erupce se odehrála 29. září.
  • Sluneční erupce, které propukly 25. října. Snímek pořídila observatoř NASA Solar Dynamic. Tato erupce je druhou ze tří, které se na Slunci v tento den odehrály.
  • Sluneční erupce 25. října.
  • První z erupcí. Vyhodocena byla jako třída X1.7.
  • Snímek mlhoviny nazvaný Hlava čarodějnice - mlhovina tak byla pojmenována pro svou podobnost s obvyklým vykreslením čarodějnice - byl pořízen sondou WISE.
  • Pohled na osvětlenou stranu planety Merkur z kosmické sondy Messenger. Snímek byl pořízen 28. října.
  • Umělecké ztvářnění galaxie označené jako z8_GND_5296. Astronomové soudí, že našli dosud nejvzdálenější galaxii; její nález posouvá pohled na vznik vesmíru asi o 700 milionů let. Světlu ze z8_GND_5296 trvalo 13,1 miliard let, než se dostalo k oběžné dráze Hubbleova teleskopu.
  • Záběr Země z kosmické sondy Juno.
  • Kometa ISON tak, jak ji zachytil Hubbleův vesmírný teleskop 9. října tohoto roku. Jde o důkaz, že kometa je dosud celistvá navzdory některým předpokladům, že se její křehké ledové jádro v důsledku sluneční aktivity rozpadne. Kometa bude mít Slunci nejblíže 28. listopadu.
  • Pohled na Mezinárodní vesmírnou stanici ISS a Zemi pod ní. Snímek vyfotografoval jeden ze členů posádky STS-130 z raketoplánu Endeavour kráce poté, co se stroj od ISS odpojil.
  • Bezpilotní komerční nákladní loď Cygnus u ISS. Šlo o test, primárním cílem bylo zjistit, zda Cygnus může stanici zásobovat.
  • Spektroradiometr MODIS pořídil snímek tajfunu Francisco během jeho "cesty" na sever přes Japonsko.
  • Jiný pohled na tajfun Francisco.
  • V říjnu NASA zveřejnila i tento úchvatný záběr prachové bouře u západní Afriky. Bouře se tam přehnala kolem 19. července 2013
  • Snímek složený ze záběrů ze sondy VIIRS z 1. srpna. Prachové bouře zajímají meteorology - pracují s teorií, že suchý a prašný saharský vzduch potlačuje vznik hurikánů v severním Atlantiku.
  • Satelit MODIS pořídil 17. října záběr lesních požárů v Austrálii. Podle tamních médií šlo o jeden z nejhorších požárů, které Nový Jižní Wales zasáhly. V 18:30 místního času hořelo na devadesáti místech, z toho na 36 místech neměli hasiči oheň pod kontrolou.
  • Satelit MODIS pořídil 17. října záběr lesních požárů v Austrálii. Podle tamních médií šlo o jeden z nejhorších požárů, které Nový Jižní Wales zasáhly. V 18:30 místního času hořelo na devadesáti místech, z toho na 36 místech neměli hasiči oheň pod kontrolou.
  • Díváte se do dílen, kde technici NASA pracují na nové vesmírné sondě. Měla by se vydat k Marsu. Odtud také její název MAVEN (Mars Atmosphere and Volatile Evolution). Jak jméno napovídá, sonda by měla studovat, co se stalo s kdysi silnou a na vodu bohatou atmosférou této planety.
  • Stroj Dream Chaser (Lovec snů), prototyp vývojářská společnosti Sierra Nevada Corporation, absolvoval v říjnu zkušební let. Nedopadl úplně slavně: Stroj mě problémy při přistání.
  • http://climate.nasa.gov/state_of_flux#Damimpact_Paraguay.jpg Dam impact, Paraguay The Yacyretá-Apipé dam is a hydroelectric plant on the Yacyretá-Apipé falls of the Paraná River, between Argentina and Paraguay. Its construction displaced human populations and affected both aquatic and terrestrial wildlife habitats. The availability of reservoir water for irrigation has led to the establishment of extensive, industrial agriculture, which has increased urban growth and pressure on watercourses. The dam also causes problems for the Iberá Wetlands, one of the most important wetlands in South America, whose delicate equilibrium allows a high level of biodiversity as well as water for human consumption. The 2008 image shows the Yacyretá reservoir and the increased number of cultivated parcels near the reservoir's edge. Source: United Nations Environment Programme (UNEP). From Latin America and the Caribbean Atlas of our Changing Environment (2010).
  • http://climate.nasa.gov/state_of_flux#Ricecultivation_Brazil.jpg Rice cultivation, Brazil Rio Grande do Sul is in the farthest southern reaches of Brazil. It hosts some 1,600 rice-production facilities, making it the main supplier of rice to the entire country. With a cultivated area of more than 1,065,000 hectares (more than 4,000 square miles), rice growing generates nearly 200,000 jobs. Seventy percent of the area uses pumps for irrigation, some of which operate with diesel engines, with resultant air and water contamination. Rice production in Rio Grande do Sul is responsible for an estimated 20 percent of Brazil's production of methane, a greenhouse gas. Fields flooded for rice cultivation are readily visible in the 2008 image as blue parcels, which are absent from the 1975 image. Source: United Nations Environment Programme (UNEP). From Latin America and the Caribbean Atlas of our Changing Environment (2010).
  • http://climate.nasa.gov/state_of_flux#Shorelinechange_Mexico.jpg Shoreline, Sonora, Mexico Left: August 7, 1993. Right: July 8, 2011. These images show changes to the western coastline of Sonora, Mexico due to the construction of shrimp farms over the past two decades. While the shrimp industry has generated profits and jobs, there have been concerns about its effect on the ecosystems of the region, and disputes have arisen about property rights to the communal coastal lands. Images taken by the Thematic Mapper sensor onboard Landsat 5. Source: USGS Landsat Missions Gallery, "Aquaculture Changes Mexican Shoreline," U.S. Department of the Interior / U.S. Geological Survey.
  • http://climate.nasa.gov/state_of_flux#Nile_Increase_930x380.jpg Agricultural growth, Egypt The amount of land devoted to farming near the delta northwest of Cairo increased dramatically between 1972 and 2003, when these images were taken. The most common crops are cotton, rice, corn, potatoes, oranges, and wheat. Land such as this produces high yields and is often harvested two or three times a year. However, areas far from the Nile often cannot be irrigated. Images taken by Landsat 1 and 5. Source: Earthshots: Satellite Images of Environmental Change, U.S. Geological Survey.
  • http://climate.nasa.gov/state_of_flux#Urbangrowth_SaudiArabia.jpg Urban growth, Saudi Arabia The Saudi Arabian capital. Left: 1972. Middle: 1990. Right: 2000. During this time, its population soared from about half a million to more than two million. In the early 1970s, three times as many Saudi Arabians lived in rural areas as in cities. By 1990, the ratio had reversed — cities held three times as many as the rural regions. Images taken by the Advanced Spaceborne Thermal Emission and Reflection Radiometer (ASTER) instrument. Courtesy of NASA/GSFC/METI/ERSDAC/JAROS and the U.S./Japan ASTER Science Team.
  • http://climate.nasa.gov/state_of_flux#Landrecovery_Ukraine.jpg Land recovery, Ukraine Chernobyl Nuclear Power Plant, 25 years after the meltdown. Left: April 29, 1986. Right: April 27, 2011. The 1986 image shows cultivated fields prepared for planting (bright, light tones), dense forest cover (dark green), and small communities (blue, purple). In the 2011 image, limited resettlement has begun. Most of the fields are now grasslands (light green), the dense forests have been destroyed and replanted (lighter, more uniform green), and the communities have been abandoned. Images taken by the Thematic Mapper sensor aboard Landsat 5. Source: USGS Landsat Missions Gallery, U.S. Department of the Interior / U.S. Geological Survey.
  • http://climate.nasa.gov/state_of_flux#Fire_NewMexico.jpg Whitewater Baldy Complex Fire, New Mexico Las Conchas, New Mexico. Left: June 24, 2011. Right: July 2, 2011. A major fire ripped through New Mexico, destroying sites considered sacred by American Indian tribes and threatening the Los Alamos National Nuclear Laboratory. The blaze, thought to have been started by a downed power line, burned more than 125,000 acres of the Santa Fe National Forest. In the July 2 image, burned areas are reddish brown and bright tones at the edge of the forest indicate active fires. June image taken by the Thematic Mapper sensor aboard Landsat 5. July image taken by the Enhanced Thematic Mapper Plus sensor aboard Landsat 7. Main source: USGS Landsat Missions Gallery, U.S. Department of the Interior / U.S. Geological Survey.
  • http://climate.nasa.gov/state_of_flux#Flooding_Brazil.jpg Samuel Dam, Rondonia, Brazil Left: June 24, 1984. Right: August 6, 2011. The Samuel Dam is located along the Jamari River in Rondonia, Brazil. These images show the area in 1984, shortly after construction of the hydroelectric dam began, and in 2011. The reservoir created by the dam flooded the upstream forest and displaced many people. Also evident in the images is the deforestation that has affected much of the region. Images taken by the Thematic Mapper sensor aboard Landsat 5. Source: USGS Landsat Missions Gallery, "Samuel Dam, Rondonia, Brazil," U.S. Department of the Interior / U.S. Geological Survey.
  • http://climate.nasa.gov/state_of_flux#Deforestation_Brazil1.jpg Deforestation, Brazil Rondônia is part of the Brazilian Amazon, on the border with Bolivia. It is one of the peripheral areas undergoing expansion within Amazonia, growing from about half a million inhabitants in 1980 to more than 1.5 million in 2009. Within the Brazilian Amazon, Rondônia has the highest deforestation rate. It reached more than 34 percent in 2008, a drastic increase from 1978 when less than 2 percent had been cut. The principal causes of deforestation in the Amazon as a whole — and especially in Rondônia — are population growth due to government-promoted immigration, the growth of the wood-products industry in conjunction with the expansion of the road network, and burning for management of pastureland and agricultural fields. Source: United Nations Environment Programme (UNEP). From Latin America and the Caribbean Atlas of our Changing Environment (2010).
  • http://climate.nasa.gov/state_of_flux#Waterchanges_CaspianSea.jpg Water changes, Caspian Sea The Kara-Bogaz-Gol basin on the eastern edge of the Caspian Sea. Left: December 4, 1972. Middle: September 25, 1987. Right: October 10, 2010. The basin's water level has periodically undergone dramatic changes, and damming of its feeder inlets increased the magnitude of those changes. In 1980, a severe drop left a "salt bowl," with windborne salt reportedly poisoning soil and causing health problems hundreds of kilometers to the east. In 1984, the basin dried up completely. In 1992, after the barrier was breached, sea level rose, remaining fairly stable from 2000 to 2010. 1972 image taken by the Multispectral Scanner aboard Landsat 1. 1987 and 2010 images taken by the Thematic Mapper sensor aboard Landsat 5. Source: USGS Landsat Missions Gallery, U.S. Department of the Interior / U.S. Geological Survey.
  • http://climate.nasa.gov/state_of_flux#AralSeashrinks_centralAsia.jpg Aral Sea shrinks, central Asia The Aral Sea, located in Kazakhstan and Uzbekistan in central Asia. Left: June 4, 1977. Center left: September 17, 1989. Center right: May 27, 2006. Right: June 3, 2009. Once one of the largest inland bodies of salty water in the world and the second largest sea in Asia — 70,000 square kilometers or 27,000 square miles in area — the Aral Sea has shrunk dramatically over the last 30 years. One of the main reasons is crop irrigation: water has been drawn off from the rivers that kept the Aral Sea filled. As the sea has shrunk, the local climate has become harsher, there have been contaminated dust storms, and drinking water and the local fishing industry have been lost. By the late 2000s, the Aral Sea had lost four fifths of its water volume. Images taken by the Multispectral Scanner onboard Landsat 1, the Thematic Mapper sensor onboard Landsat 5, and the Enhanced Thematic Mapper Plus onboard Landsat 7. Source: USGS Landsat Missions Gallery, "The Vanishing Aral Sea," U.S. Department of the Interior / U.S. Geological Survey and Encyclopaedia Britannica Online.
  • http://climate.nasa.gov/state_of_flux#Beijing_China_930x396.jpg Urban growth, China These images show the growth of Beijing from 1977 to 2011. Blue tones represent buildings and pavement, while red tones indicate natural and agricultural vegetation. In the 1970s, many people who spent the Cultural Revolution in the countryside returned to Beijing, and others came seeking jobs. 1979 brought a boom in housing construction. In the 1980s, many industrial plants were moved from the central city to outlying areas, and it became more common to live and work in different places. Beijing's 2012 population is estimated at just over 17 million, with a population density of about 5,000 people per square kilometer (about 13,000 people per square mile). Images taken by Landsat 2 and 5. Source: Earthshots: Satellite Images of Environmental Change, U.S. Geological Survey.
  • http://climate.nasa.gov/state_of_flux#Urbangrowth_Indonesia.jpg Urban growth, Indonesia Jakarta, Indonesia. Left: 1976, with a population of six million. Middle: 1989, with nine million inhabitants. Right: 2004, with 13 million inhabitants. Jakarta was the last Hindu kingdom of West Java when the Portugese arrived in 1522. They were driven out 5 years later by Muslim saint and leader Sunan Gunungjati, who renamed the city Jayakarta. In the 17th century the Dutch captured the city, fortified and walled it, and renamed it Batavia. After World War II, Dutch colonial power came to an end when Soekarno declared the Republic of Indonesia. This time series of images shows the growth of the city over the past few decades; vegetation is rendered in red and urban areas shown in blue-grey. 1976 image acquired by the Landsat MSS scanner. 1989 image taken by the Landsat Thematic Mapper. 2004 picture captured by ASTER. Credit: NASA/GSFC/METI/ERSDAC/JAROS and the U.S./Japan ASTER Science Team. Caption adapted from the ASTER gallery. hide credits download image
  • http://climate.nasa.gov/state_of_flux#Riverchanges_China.jpg River changes, China The Yellow River Delta in China. Left: 2001. Right: 2009. The Yellow River is the second-longest river in China, and the sixth-longest in the world. It has been the cradle of Chinese civilization; but frequent devastating floods have also earned it the name of "China's Sorrow." Historical maps tell us that the river has undergone many dramatic changes in its course. Currently, the Yellow River ends in the Bohai Sea, yet its eastern terminus continues to oscillate from points north and south of the Shandong Peninsula. These images show the changes. Images taken by NASA's Advanced Spaceborne Thermal Emission and Reflection Radiometer (ASTER) instrument. Caption adapted from the ASTER gallery. Courtesy of NASA/GSFC/METI/ERSDAC/JAROS and the U.S./Japan ASTER Science Team.
  • http://climate.nasa.gov/state_of_flux#Urbangrowth_China.jpg Binhai New Area, China The Binhai New Area — once home to salt farms, reed marshes and wasteland — has grown into one of China's key economic hubs. Since development began in the 1990s, it has become the home of numerous aerospace, oil, chemical and other manufacturing industries. Plans for coming years include an international airport. The changes over 20 years can be seen in these images acquired in 1992 and 2012. The Binhai New Area is located on the coast of the Bohai Sea Region southeast of China's capital city, Beijing. 1992 image taken by the Thematic Mapper sensor onboard Landsat 5. 2012 image taken by the Enhanced Thematic Mapper Plus sensor onboard Landsat 7. Source: U.S. Geological Survey (USGS) Landsat Missions Gallery, "Binhai New Area, China," U.S. Department of the Interior / USGS.
  • http://climate.nasa.gov/state_of_flux#Agriculturalgrowth_SaudiArabia.jpg Syrian Desert, Saudi Arabia Wadi As-Sirhan, Saudi Arabia. Left: February 2, 1986. Right: February 12, 2004. Once so barren it could barely support the towns of Al'Isawiyah and Tubarjal (upper left of each image), a vast desert region gradually blossomed into crop-producing fields (green dots) by use of center-pivot irrigation. The system used here draws from an ancient aquifer containing water as much as 20,000 years old. Judicious use of water resources and climate-appropriate technology has improved food production without harming the environment. Image by Landsat. Source: United Nations Environment Program (UNEP) (2005). One Planet Many People Atlas of our Changing Environment; Division of Early Warning and Assessment (DEWA) UNEP; Nairobi, Kenya.
  • http://climate.nasa.gov/state_of_flux#Agriculturalgrowth_SaudiArabia1.jpg Agricultural growth, Saudi Arabia Only a few centimeters (about one inch) of rain falls in the Saudi Arabian desert each year, but crops still grow thanks to aquifers deep below the surface, which contain water trapped during the last Ice Age and rainwater that fell over several hundred thousand years. Saudi Arabia drills through the desert floor and irrigates the fields with a circular sprinkler system known as center-pivot irrigation. Hydrologists estimate that it will be economical to pump this water only for about 50 more years. In these images, the agricultural fields are about one kilometer (0.6 miles) across. Healthy vegetation appears bright green while dry vegetation looks orange. Barren soil is dark pink and urban areas, like the town of Tubarjal at the top of each image, are purple. See also this image. Images taken by the Thematic Mapper sensor onboard Landsat 4 and 5, and the Enhanced Thematic Mapper Plus sensor onboard Landsat 7. Source: NASA/Aries Keck, Goddard Space Flight Center.
  • http://climate.nasa.gov/state_of_flux#Wetlandchanges_Nigeria.jpg Wetland changes, Nigeria Left: November 1984. Right: November 2009. The Inner Niger Delta is the largest wetland in Western Africa. It spreads out along a flat 200-kilometer (124-mile) stretch of the Niger River as it passes through the Sahel on its way to the southern edges of the Sahara Desert. The delta supports about one million people and a variety of ecosystem goods and services, including a productive fishery, pasture for sheep and cattle, land and water for agriculture and habitat for natural flora and fauna. The flooding that replenishes the wetland depends mainly on rainfall over the upper Niger River in the Guinean Highlands, and to a lesser extent in the Bani watershed in northern Cote d'Ivoire. Rainfall over the delta itself contributes only 5 to 10 percent of the delta's water. The 1984 image was taken during a prolonged drought, while the 2009 image follows a year of more normal precipitation. Source: United Nations Environment Programme (UNEP). From Africa Water Atlas (2010); Division of Early Warning and Assessment (DEWA), UNEP, Nairobi, Kenya.
  • http://climate.nasa.gov/state_of_flux#Desertchanges_Egypt.jpeg Al Farafra Oasis, Egypt Unlike much newly developed desert agriculture, the western Egyptian fields seen here are watered not by deep-well irrigation, but rather with surface water associated with the Al Farafra Oasis. These images show the increased agricultural activity near the town of Qasr al Farafra. Increased accessibility from improved infrastructure, including paved roads to the town, brings both agricultural laborers and tourists. Images taken by the Thematic Mapper sensor onboard Landsat 5 and the Enhanced Thematic Mapper Plus onboard Landsat 7. Source: U.S. Geological Survey (USGS) Landsat Missions Gallery, "Al Farafra Oasis," U.S. Department of the Interior / USGS and NASA.
  • http://climate.nasa.gov/state_of_flux#Oilproduction_Kazakhstan.jpg Mangystau Province, Kazakhstan Left: August 6, 1987. Right: July 23, 2011. The landscape of Kazakhstan's Mangystau Province, near the Caspian Sea, has changed since oil and gas deposits in the region began to be exploited in the early 1990s. The 2011 image shows production facilities in the desert with settlements built around them. Increased fossil fuel production in this area has raised concerns about the quality and availability of freshwater needed for rural development and public health. Images taken by the Thematic Mapper sensor onboard Landsat 5. Source: USGS Landsat Missions Gallery, "Expanding Oil Production in Mangystau Province, Kazakhstan," U.S. Department of the Interior / U.S. Geological Survey.
  • http://climate.nasa.gov/state_of_flux#Lakedegradation_Tunisia.jpg Lake degradation, Tunisia Ichkeul Lake, northern Tunisia. Left: November 14, 2001. Right: July 29, 2005; the water level is higher, but a large part of the lake appears red due to the presence of aquatic plants. Ichkeul Lake and wetlands are a major stopover point for hundreds of thousands of migrating birds who come to feed and nest. It is the last remaining lake in a chain that once extended across North Africa, and has badly deteriorated as a result of the construction of three dams on rivers supplying it and its marshes, which have cut off almost all inflow of freshwater. The Tunisian government plans to undertake various measures to retain freshwater in the lake on a year-round basis and reduce the salinity of the lake. Images taken by the Advanced Spaceborne Thermal Emission and Reflection Radiometer (ASTER) onboard NASA's Terra satellite. Credit: NASA/GSFC/METI/ERSDAC/JAROS and the U.S./Japan ASTER Science Team. Source: the ASTER gallery.
  • http://climate.nasa.gov/state_of_flux#Deforestation_Bolivia1.jpg Deforestation, Bolivia Left: June 17, 1975. Middle: July 10, 1992. Right: August 1, 2000. This area lies east of Santa Cruz de la Sierra, Bolivia, in an area of tropical dry forest. Since the mid-1980s, the resettlement of people from the Altiplano (the Andean high plains) and a large agricultural development effort (the Tierras Baja project) have led to deforestation in this area. Images taken by the Landsat mission. Credit: NASA/USGS.
  • http://climate.nasa.gov/state_of_flux#Waterdiversion_DeadSea.jpg Water diversion, Dead Sea Left: November 9, 1984. Right: November 28, 2011. The Dead Sea lies in the Jordan Rift Valley, bordering Jordan, Israel and the West Bank. It is one of the world's saltiest bodies of water, too salty to harbor any life other than bacteria. Minerals from the sea, however, are extracted for various industrial purposes. Mineral evaporation ponds have replaced open water in the southern part of the sea, as can be seen in the 2011 image. In recent decades, the Dead Sea has shrunk as water has been diverted from the Jordan River, the sea's main tributary. A plan has been announced to replenish the Dead Sea by building a canal from the Red Sea, providing fresh (desalinated) water to Jordan en route. 1984 image taken by the Thematic Mapper sensor onboard Landsat 5. 2011 image taken by the Enhanced Thematic Mapper Plus sensor onboard Landsat 7. Source: USGS Landsat Missions Gallery, "The Dead Sea," U.S. Department of the Interior / U.S. Geological Survey.
  • http://climate.nasa.gov/state_of_flux#Dubai_Islands_930x462.jpg Dubai Islands The city of Dubai is situated along the Persian Gulf in the United Arab Emirates. In 2001, work began to create artificial archipelagos along Dubai's shoreline. The results are visible in the 2012 image: Palm Jebel Ali, the smaller Palm Jumeirah and, north of the two "palm islands," a group of smaller islands known as "The World" because they are roughly in the shape of a world map. The World provides an additional 144 miles of shoreline. Images taken by the Enhanced Thematic Mapper Plus sensor onboard Landsat 7. Source: U.S. Geological Survey (USGS) Landsat Missions Gallery “Dubai’s Islands,” U.S. Department of the Interior / USGS and NASA.
  • http://climate.nasa.gov/state_of_flux#Deforestation_Bolivia.jpg Deforestation, Bolivia Near Santa Cruz de la Sierra, Bolivia. Left: August 4, 1986. Right: August 11, 2001. Most of the tropical dry forest visible in the 1986 image (dark red) has been replaced in the 2001 image by resettlement of people from the Altiplano (the Andean high plains) and by soybean production. The radial patterns are part of the San Javier resettlement plan. At the center of each unit is a small community that includes a church, bar/cafe, school and soccer field. The rectangular, light-colored areas are fields of soybeans cultivated for export. The dark strips running through the fields are windbreaks to protect the soil, which is prone to wind erosion 1986 image taken by Landsat. 2001 image taken by the Advanced Spaceborne Thermal Emission and Reflection Radiometer (ASTER). Reproduced from JPL's ASTER website. Courtesy of NASA/GSFC/METI/ERSDAC/JAROS, and the U.S./Japan ASTER Science Team.
reklama